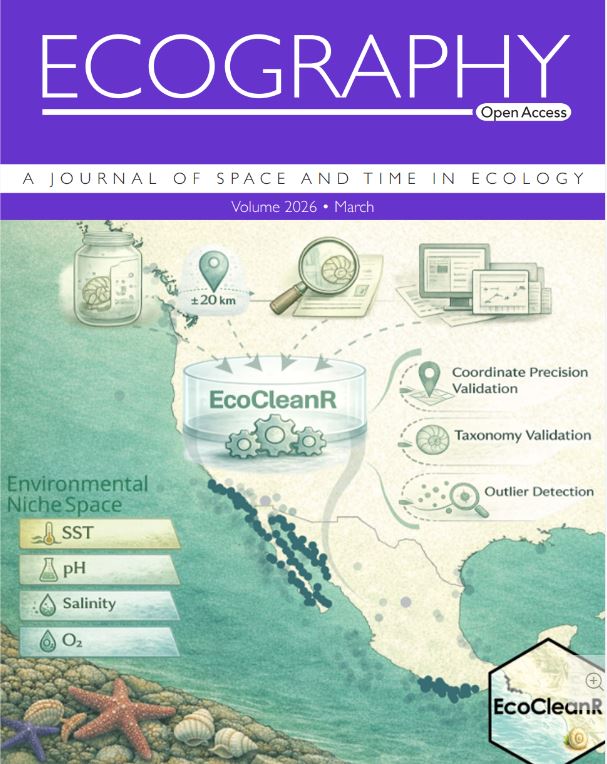
A schematic illustration of the EcoCleanR workflow, showing the transformation of raw biodiversity data into refined geographic and environmental representations of species distributions. This cover is done partially on AI (canva) to make the icons and then most of the work was done on Adobe illustrator by Priyanka Soni. Full open access paper here.
 Download high resolution file: