Integrating phylogenetic community structure with species distribution models
Submitted by ecography on 8 July 2014.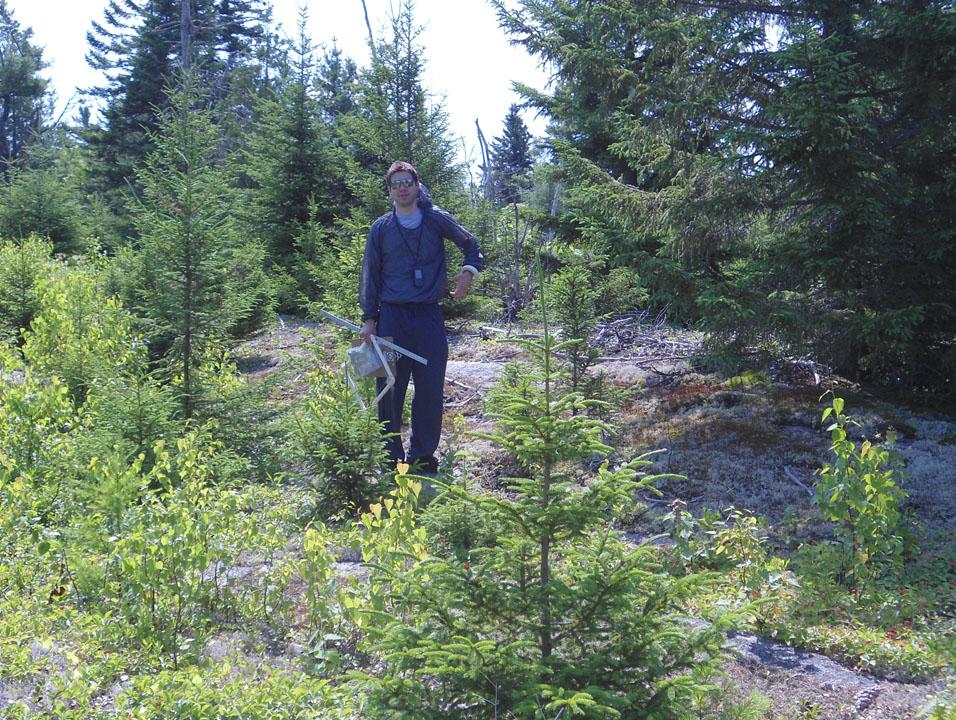
Blog post by Oluwatobi A. Oke, Stephen B. Heard and Jeremy T. Lundholm
Our paper combines approaches from phylogenetic community ecology and species distribution modeling to understand the assembly of plant communities on rock barrens. It was enormous fun to be involved with this work, in part because before we started I knew nothing about SDMs and next to nothing about rock barrens. Thank goodness for coauthors!
The project began to take shape when 1st author Oluwatobe “Tobi” Oke started graduate work, with joint supervision by 3rd author Jeremy Lundholm and me. Tobi initially wanted to ask whether phylogenetic community structure could predict ecosystem function in green roofs. I knew something about phylogenetic community structure, and Jeremy knew lots about green roofs. This made it an interesting project for both of us, and we saw potential for our complementary experience leading to some connections between subfields. But it was the unplanned connections as Tobi’s project developed that I think really paid off. Here’s how that played out.

Field assistant Holly Abbandonato on a barrens.
Rock barrens (treeless areas within forests where bedrock lies at or just below the soil surface) are a natural analogue to green roofs, which minimize weight by using plants grown in shallow trays with relatively little soil. In regions where barrens occur, they’re also a potential source of native plant species for deployment in green roofs. Tobi intended to study the green-roof performance of barrens plants grown in different combinations. As a point of comparison, he decided to measure phylogenetic community structure on the natural barrens from which he was collecting. This was mostly straightforward in execution (although I probably should have realized more quickly that sites defined by the absence of trees wouldn’t be well-served by New Brunswick’s network of logging roads!). We found that at the quadrat scale, barrens plants showed strong phylogenetic clustering, a pattern that’s often presumed to arise from environmental filtering; that is, to arise when community membership is determined by tolerance of local environmental conditions, rather than by the outcome of competition. This makes sense if closely related species have similar environmental tolerances: each quadrat will contain a set of close relatives that share tolerance for conditions in that quadrat. But phylogenetic community ecology has recently seen some pointed discussion over whether it’s wise, or even possible, to infer ecological processes behind community assembly from patterns of relatedness among co-occurring species (Vamosi et al. 2009, Mayfield and Levine 2010, HilleRisLambers et al. 2012). So far, we had no way to close the gap between pattern and process.

Field assistant Alex Abbandonatao at a barrens edge.
The most obvious way to close that gap would have been to gather ecological trait data for all our plant species, so that we could ask whether the traits that determine occurrence at a site are phylogenetically conserved (so that filtering could drive phylogenetic clustering). But this is a daunting prospect: we’d have to identify the abiotic factors determining local occurrence, figure out which traits of individual plants were relevant to the action of those factors, and measure trait values for all our species. Very few studies have managed to do all that (Vamosi et al. 2009), and I doubt that we could have either
Tobi, though, had a really exciting insight: maybe we could close the gap instead using species distribution modeling (Elith et al. 2006). As he explained this (because I was a complete rookie), I got the feeling we were about to make a real leap. After all, SDMs can be built from plant occurrence data that are easily available, and can be used to deduce the abiotic factors controlling plant distributions. Not only that, but (although nobody seemed to have taken advantage of this), the parameter values from fitted SDMs can be interpreted as trait values describing the response of each plant species to those abiotic factors! They aren’t “conventional” functional traits like specific leaf area or stomatal conductance, but in a way they’re even better: they’re ecologically integrative, measuring the overall response of the plants to each modeled abiotic factor. If we could pull this off for our barrens species, we’d have the trait values we needed to connect phylogenetic pattern to ecological process.
We think we did pull it off. For our 9 most common barrens species, SDMs strongly suggested drought stress as the most important abiotic driver of plant distribution, and the parameter values measuring the shapes of our species’ occurrence functions (which we interpret as drought-tolerance traits) showed strong phylogenetic pattern. This supports a process-based explanation (environmental filtering on drought tolerance) for the observed pattern in phylogenetic community structure (strongly phylogenetic clustering). Fist pumps were in order!
What we don’t know yet, of course, is whether our approach will work for other communities the way it worked for us in rock barrens. Maybe it won’t; but if it does, it promises a powerful approach to studying community assembly based on data that are relatively simple to obtain: distributional data from herbarium records, local co-occurrence data from quadrat surveys, and phylogenetic hypotheses from online tools that are (mostly) automated and easy to use. All this because Tobi realized that two apparently unrelated techniques, twisted just the right way, fit together to do something new.
Finally, I think there is a useful lesson to be had for our discipline as a whole: being a little bit scattered academically is not a bad thing. Over the years I’ve published on everything from the topology of phylogenetic trees (e.g. Heard 1992) to stream ecology (e.g., Heard and Buchanan 2004) to the diversity of T-cell response to viral challenge (e.g. Kedzierska et al. 2006). While this has its costs, and even irritates some of my colleagues, it has three big advantages. First, it keeps me interested. Second, it means I get to know colleagues working in many different areas – which is how Jeremy and I first came to talk about having a student together. Finally, it means I sometimes get involved with work that makes new connections between fields. We think our barrens paper is a really good example, and we were all very excited to see it develop.
References
Elith, J., Graham, C. H., Anderson, R. P., et al. 2006. Novel methods improve prediction of species' distributions from occurrence data. - Ecography 29: 129-151
Heard, S. B. 1992. Patterns in tree balance among cladistic, phenetic, and randomly generated phylogenetic trees. - Evolution 46:1818-1826.
Heard, S. B. and C. K. Buchanan. 2004. Grazer-collector facilitation hypothesis supported by laboratory but not field experiments. - Canadian Journal of Fisheries and Aquatic Sciences 61:887-897.
HilleRisLambers, J., Adler, P. B., Harpole, W. S., Levine, J. M. and Mayfield, M. M. 2012. Rethinking community assembly through the lens of coexistence theory. - Annual Review of Ecology Evolution and Systematics 43: 227-248.
Kedzierska, K., E. B. Day, J. Pi, S. B. Heard, P.C. Dohorty, S. J. Turner, and S. Perlman. 2006. Quantification of repertoire diversity of influenza-specific epitopes with predominant public or private TCR usage. - Journal of Immunology 177:6705-6712.
Mayfield, M. M. and Levine, J. M. 2010. Opposing effects of competitive exclusion on the phylogenetic structure of communities. - Ecology Letters 13: 1085-1093.
Vamosi, S.M., S.B. Heard, J.C. Vamosi, and C.O. Webb. 2009. Emerging patterns in the comparative analysis of phylogenetic community structure. - Molecular Ecology 18:572-592.